A management dashboard with figures nobody argues about
Monday’s meeting should not start with an argument about which figure is right. We build the screen management opens to make decisions: a few indicators, each with a written definition, drawn from the systems you already have and refreshed as often as genuinely needed.
1Three versions of the same figure
Sales says one figure was sold this month, finance says another, and the management software shows a third. Nobody is lying: one counts orders, another invoices, and the third deducts credit notes. The meeting is spent reconciling and the decision is put off.
A dashboard is not a document that arrives by itself every week; that is a different process, automated reports. It is the live screen you return to when deciding whether to hire, whether to chase a late-paying customer or whether a product line makes a margin. So the first step is not the chart but agreeing what each number means.
2One definition sheet per indicator
Before drawing anything, every indicator gets a written definition approved by management. For “sales this month”, for example:
- What it counts: invoices issued in the month, excluding tax, net of credit notes. What it does not: uninvoiced orders or carriage.
- Where it comes from: the invoice table in the management software, not the sales team’s spreadsheet.
- How often it refreshes: nightly is enough; a monthly figure does not need real time.
- Who answers for it: the person you ask when it does not add up.
- Which threshold triggers an alert, and who receives it.
3Where the data comes from
Hardly ever from a single place. Usually it means combining the management software, the accounts, the CRM, the bank and the odd spreadsheet that is not going away, such as the annual budget. We build an intermediate layer that copies what is needed from each source, as often as each indicator requires, and that raises an alert when a load fails instead of showing old data as if it were today’s.
Spreadsheets that stay in use get a fixed template, so a moved column does not silently break the dashboard. And every figure can be opened down to the lines behind it: which invoices, which customers, which orders.
4Few figures, useful alerts and each person their own
The first screen should hold no more indicators than fit in a conversation: forecast cash, order book, overdue receivables, margin by line and little else. Everything else is a click away. Alerts go to whoever can act, not to everyone, and only when something crosses the agreed threshold.
Each person sees what concerns them: management, everything; an area manager, their area; a plant manager, their plant. Those permissions are defined with you and enforced on the data itself, not just by hiding screens.
- Typical mistake: forty charts nobody looks at after the first week.
- Typical mistake: indicators with no owner, which stop updating without anyone noticing.
- Typical mistake: figures that cannot be traced to their source and that, for that reason, nobody believes.
5Where we already do something similar
Farmacta
A pharmacy’s back office, built on its paperwork
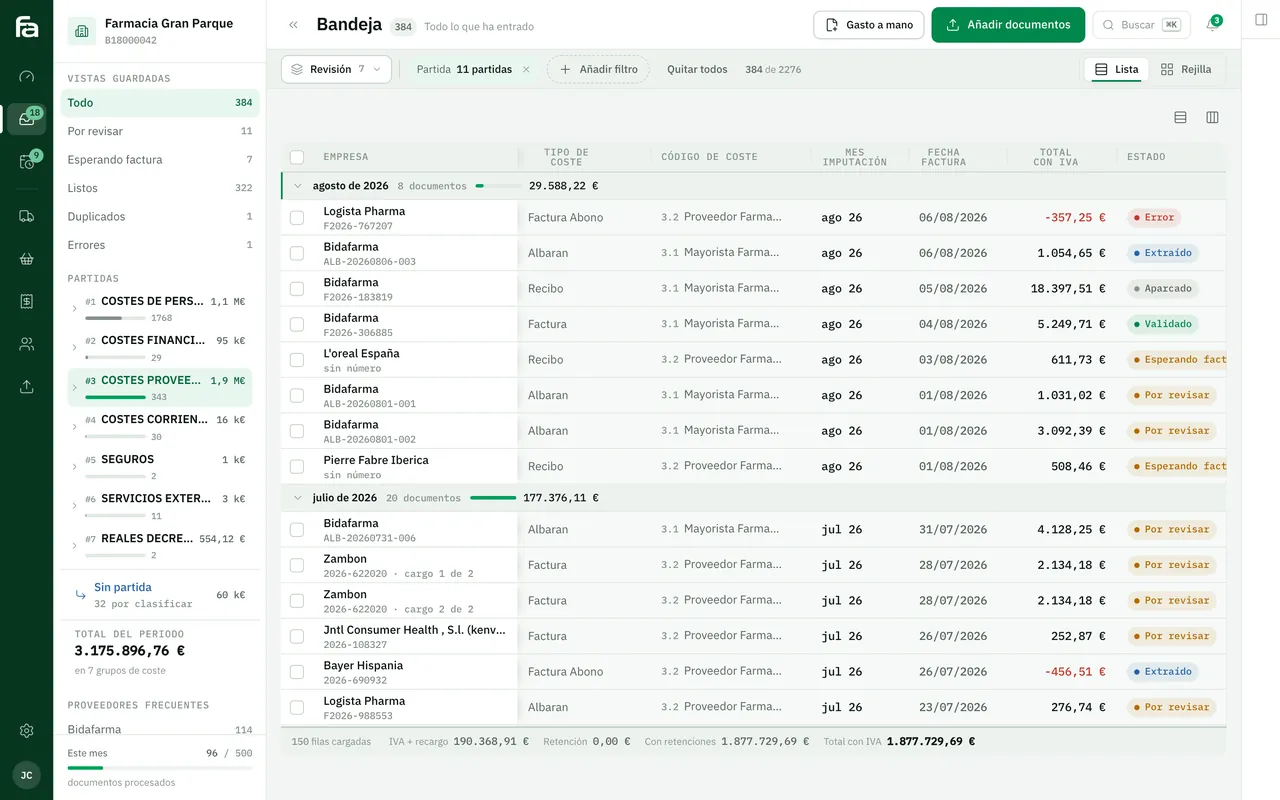
Farmacta reads a pharmacy’s invoices and delivery notes and, from that reviewed data, produces due dates, cash flow and purchasing analytics. It is a dashboard that grows out of the documents rather than out of separate data entry. In use at its first pharmacy.
In use at its first pharmacy

Certero
Tender intelligence for public works
Certero accompanies every bid recommendation with the data that explains it: authorities, scoring formulas and competitors. It is the principle we apply to any indicator: a figure that cannot be traced is no use for deciding. We do not yet have a published management dashboard case for an SME.
Live at certero.es. Accepted into NVIDIA Inception.
6Frequently asked questions
Why not use Power BI or Looker Studio?
They can be a good choice for the visual side, and if they are enough, use them. The hard part usually comes earlier: defining each figure, joining the sources and cleaning the data. We can build that part and draw the charts in whichever tool you prefer.
Do we need real-time data?
Rarely. Cash may need today’s figure and the order book the last hour’s, but monthly margin gains nothing from refreshing every minute. Matching the frequency to the need makes it cheaper and simpler.
What if the source data is wrong?
We will find out early, because defining each figure brings the inconsistencies to light. The dashboard flags them and we tell you where they originate; fixing them at source is part of the work.
Who changes a definition when the business changes?
Each indicator’s sheet has an owner. If the definition changes, the date it applies from is recorded, so comparisons with earlier months still make sense.
Bring us the three figures that cause the most argument
We will write their definitions with you and see which systems they would come from. It is the best way to find out whether your dashboard is a small project or a large one.
Tell us your problem